Stock Indicator ML
A lightweight Machine Learning model that predicts the stock market using years of S&P 500 data
Project Overview
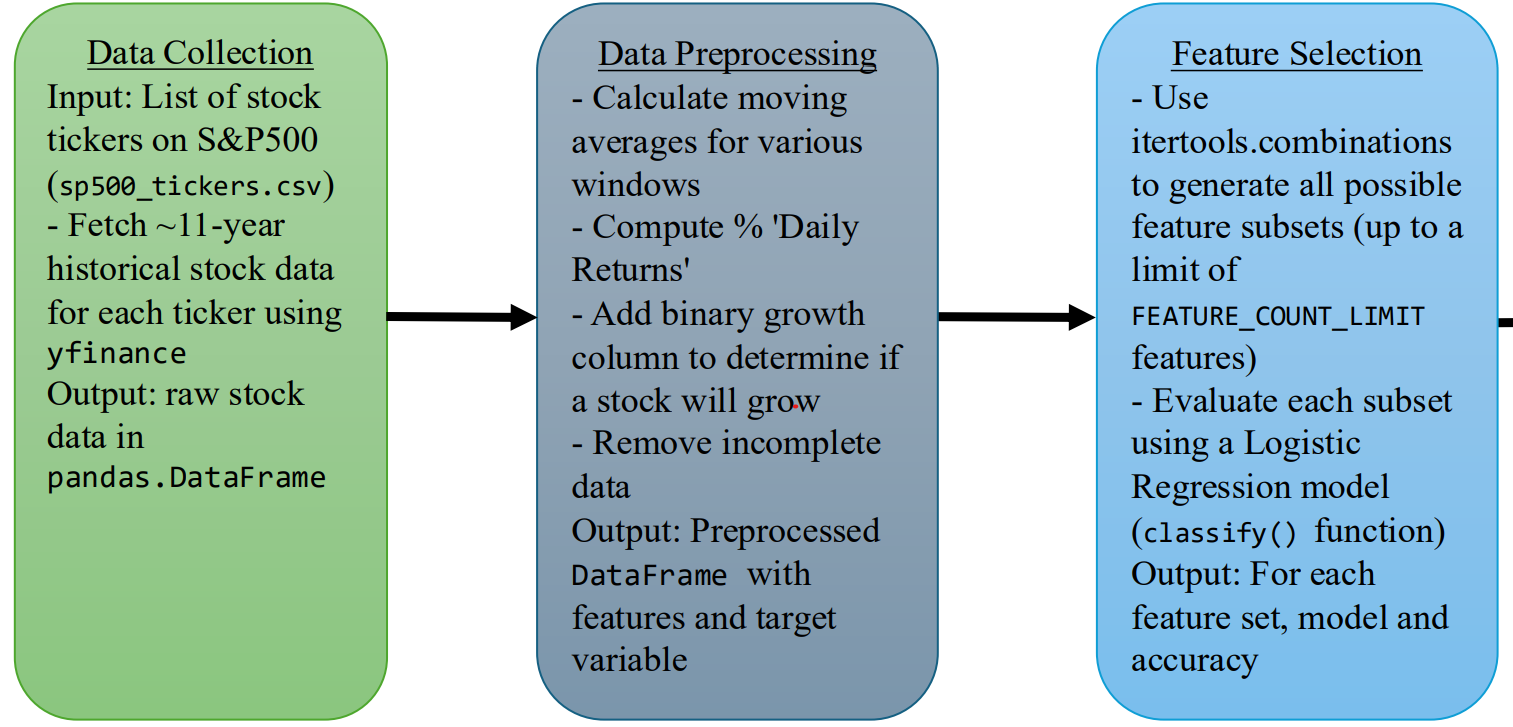
This machine learning project focuses on stock market prediction using historical S&P 500 data. The lightweight model analyzes market patterns, technical indicators, and price movements to provide predictions for stock market trends and potential investment opportunities.
Key Features
- • S&P 500 data collection using yFinance API
- • Technical indicator calculation (RSI, MACD, Moving Averages)
- • Feature engineering for price patterns and volume analysis
- • Machine learning model training on historical data
- • Stock price prediction and trend analysis
- • Logistic Regression model
- • Risk assessment and confidence scoring
- • Lightweight and efficient processing pipeline
Technical Approach
- • Data collection from Yahoo Finance API (yFinance)
- • Feature engineering with technical indicators
- • Data preprocessing and normalization
- • Logistic Regression model
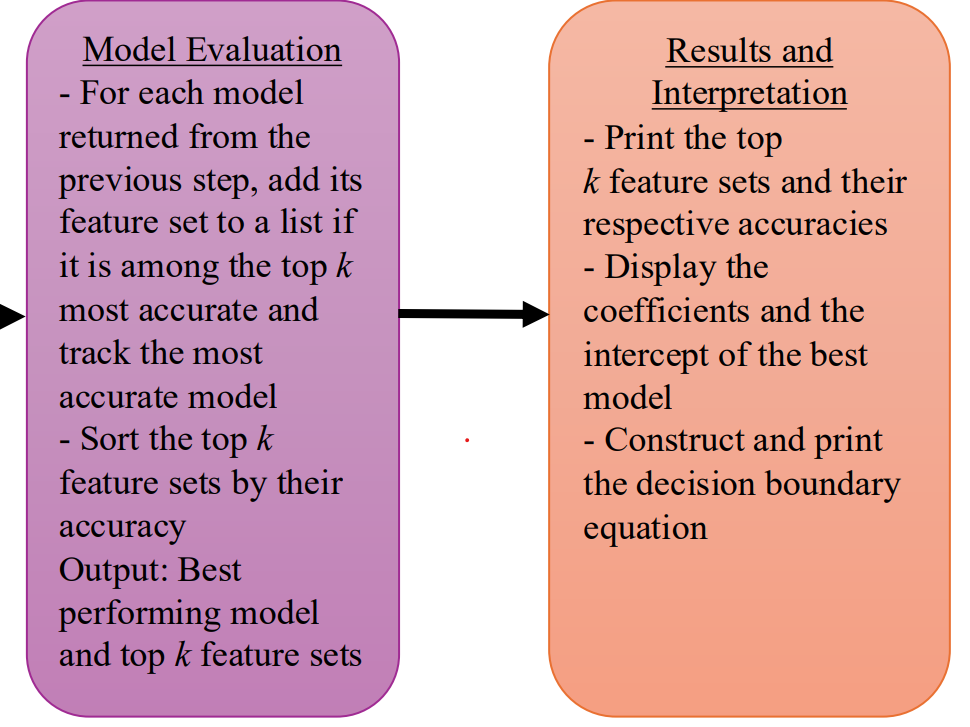
- • Cross-validation for model reliability
- • Performance evaluation with financial metrics
- • Visualization of predictions and market trends
Results & Insights
Model Performance
Successfully predicted stock market trends with around 80% accuracy. Weighs features like Daily Return much higher than other features.
Improvements
A more complex model such as K nearest neighbors would greatly improve the accuracy of the model. A quicker addition that could improve accuracy would be PCA for dimension reduction. Also could run it with more than 4 features in a set but was limited by computational power/time.
Accuracy
Model
Features Chosen